What is Chat2CSV?
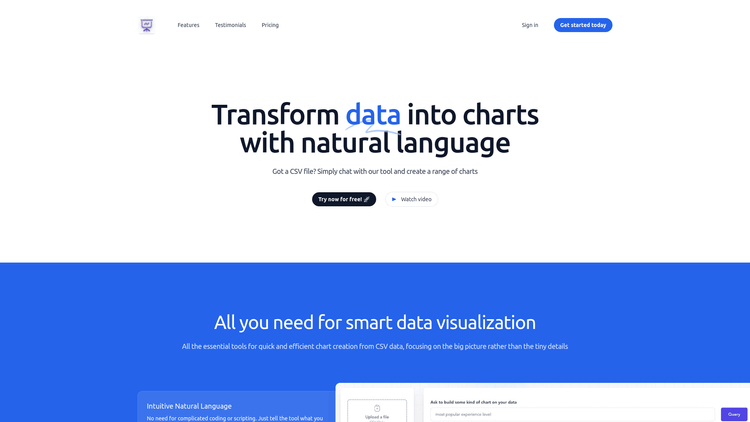
Chat2CSV is a revolutionary tool geared towards making data visualization a breeze. Embracing the capabilities of artificial intelligence and user-friendly interfaces, Chat2CSV allows users to transform raw data from CSV files into a range of dynamic charts, without the need for complex coding or scripting. All users have to do is interact with the tool in natural language, like 'create a bar chart of the sales by region.' This ease and convenience make it a go-to solution for businesses, analysts, and individuals seeking to make sense of their data in a visual and intuitive way.
Furthermore, Chat2CSV underscores the importance of data security and privacy in the digital age. While processing commands, it only interacts with metadata, leaving the actual data on your side. Thus, users can enjoy the convenience of data visualization without compromising the safety of their sensitive information. This safeguarding feature sets Chat2CSV apart as a secure and reliable tool for exploring and understanding data.
The platform offers a diverse range of chart options, giving users the freedom to customize their visualization based on the unique characteristics of their data. From pie charts and scatter graphs to line data and bar charts, users can choose the best way to represent their data. The versatility, combined with ease of use, makes Chat2CSV a preferred choice for data-driven insights.
How to Use Chat2CSV: Step-by-Step Guide to Accessing the Tool
Engaging with Chat2CSV is straightforward, making it a great option for users across all skill levels. Depending on your needs, you can start with the free access plan and upgrade as your data visualization needs increase. The tool is designed to offer flexibility and scalability in line with your data trends and analysis techniques.
Here is a simple step-by-step guide on how to use Chat2CSV:
- Upload your CSV file on the platform.
- Engage with the tool in natural language, specifying the type of chart you want to create.
- The AI will process your metadata and provide suggestions for the best way to visualize your data.
- Choose your preferred chart type and proceed to create the visualization.
- Once your chart is ready, you can explore the data from different perspectives and uncover unique insights.
Chat2CSV Use Cases
Chat2CSV is an extremely versatile tool that can be used within various professional contexts. Businesses of all sizes find this platform tremendously useful for analyzing sales data, optimising business strategies, and enhancing decision-making processes. With the ability to quickly create visually stunning and comprehensive charts, managers can effortlessly monitor key performance indicators and identify potential areas of growth or improvement within their organization.
Furthermore, Chat2CSV’s AI assistant, akin to having a personal data scientist, can suggest chart types to view data in uniquely insightful ways. This feature, coupled with robust data privacy assurances, makes the tool a trustworthy choice for sensitive data analysis in areas like finance, healthcare, and human resources.
Additionally, the tool is also handy for individuals seeking to comprehend personal data or hobbyists interested in making sense of data trends in their fields of interest. With no complicated software learning involved, anybody can turn raw numbers into valuable insights with Chat2CSV.
